Short on time? Click here for the TL;DR
CTV News has released Canada’s first COVID variant tracker. Thanks to Jesse Tahirali and Stephanie Liu for curating this invaluable resource.
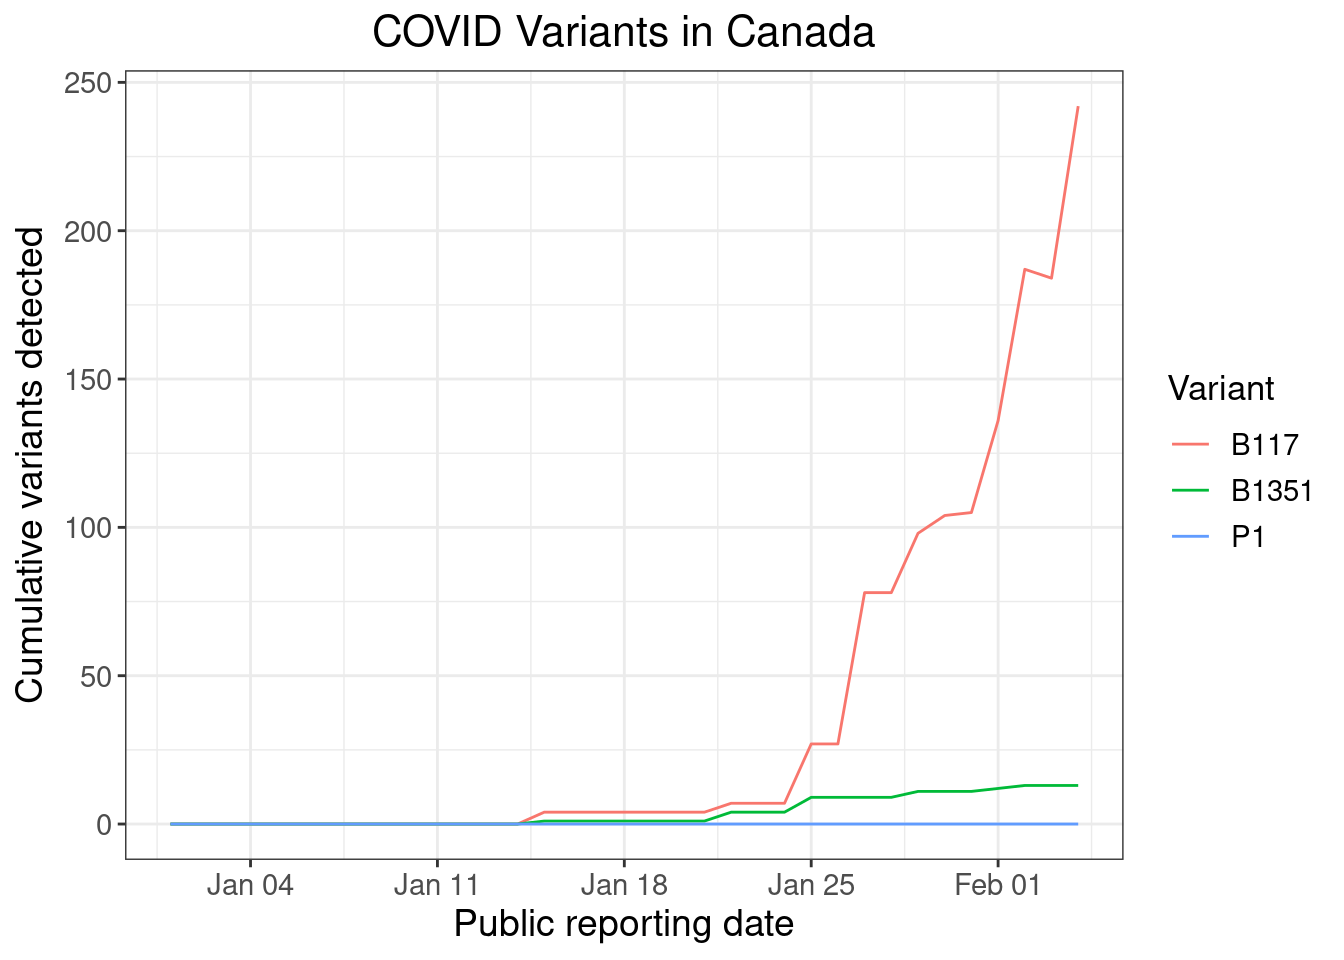
I scraped the underlying time series, which I plotted to show the progression of COVID variant detection in Canada.
Detection of COVID variants will increase over the coming weeks as surveillance ramps up and as B.1.1.7 gains market share. B.1.1.7 is still growing exponentially, even as overall cases shrink.
The recent experience of the UK shows that variants can still be controlled using non-pharmaceutical measures, but this must begin with a recognition of the importance of airborne transmission.
CTV releases Canada’s first COVID variant tracker
Last night, CTV News launched a new COVID variant tracker, curated by Jesse Tahirali and Stephanie Liu. The variants covered by this tracker comprise B.1.1.7 (“the UK variant”), B.1.351 (“the South African variant”) and P1 (“the Brazilian variant”). The common names for these variants derive from the first nation where they were detected, not necessarily where these variants first arose. The UK, for example, has excellent genomic surveillance, making it particularly likely to discover new virus variants.
Scraping the underlying data
For the moment, CTV’s tracker only displays the cumulative number of variants detected in each province. However, the underlying data are stored as a time series in JSON. We can scrape it and turn it into a usable table using a little R code.
# load packages
library(jsonlite)
suppressPackageStartupMessages(library(dplyr))
library(tidyr)

# load and process data
variants <- fromJSON("https://beta.ctvnews.ca/content/dam/common/exceltojson/COVID-Variants.txt", flatten = FALSE) %>%
  ## remove blank data and summary data
  filter(!Date %in% c("", "Updated", "Total")) %>%
  ## convert Excel dates
  mutate(date = as.Date(as.integer(Date), origin = "1899-12-30"))

# create usable table
variants <- bind_cols(
  select(variants, date, contains("B117")) %>%
    pivot_longer(
      cols = ends_with("B117"),
      names_to = c("province", ".value"),
      names_sep = "_",
      values_to = "B117",
      values_transform = list(B117 = as.integer)
    ) %>%
    arrange(date, province) %>%
    group_by(province) %>%
    fill(3, .direction = "down") %>%
    ungroup,
  select(variants, date, contains("B1351")) %>%
    pivot_longer(
      cols = ends_with("B1351"),
      names_to = c("province", ".value"),
      names_sep = "_",
      values_to = "B1351",
      values_transform = list(B1351 = as.integer)
    ) %>%
    arrange(date, province) %>%
    group_by(province) %>%
    fill(3, .direction = "down") %>%
    ungroup %>%
    select(3),
  select(variants, date, contains("P1")) %>%
    pivot_longer(
      cols = ends_with("P1"),
      names_to = c("province", ".value"),
      names_sep = "_",
      values_to = "P1",
      values_transform = list(P1 = as.integer)
    ) %>%
    arrange(date, province) %>%
    group_by(province) %>%
    fill(3, .direction = "down") %>%
    ungroup %>%
    select(3)
) %>%
  replace_na(list(B117 = 0, B1351 = 0, P1 = 0))

# preview table
tail(variants)
## # A tibble: 6 x 5
## date province B117 B1351 P1
## <date> <chr> <dbl> <dbl> <dbl>
## 1 2021-02-04 NU 0 0 0
## 2 2021-02-04 ON 152 1 0
## 3 2021-02-04 PE 0 0 0
## 4 2021-02-04 QC 8 0 0
## 5 2021-02-04 SK 3 0 0
## 6 2021-02-04 YT 0 0 0This provides us with a cumulative time series of detected variants by province and date.
Data caveats
There are a few oddities with the data. For example, cumulative B.1.1.7 detections seem to fall from February 2 to February 3. However, this is entirely consistent with the Public Health Ontario daily reports from these days: on February 2, the Simcoe Muskoka District Health Unit reported 51 cumulative detections; on February 3, they reported 44 cumulative detections. This indicates either a data error or data correction occurred.
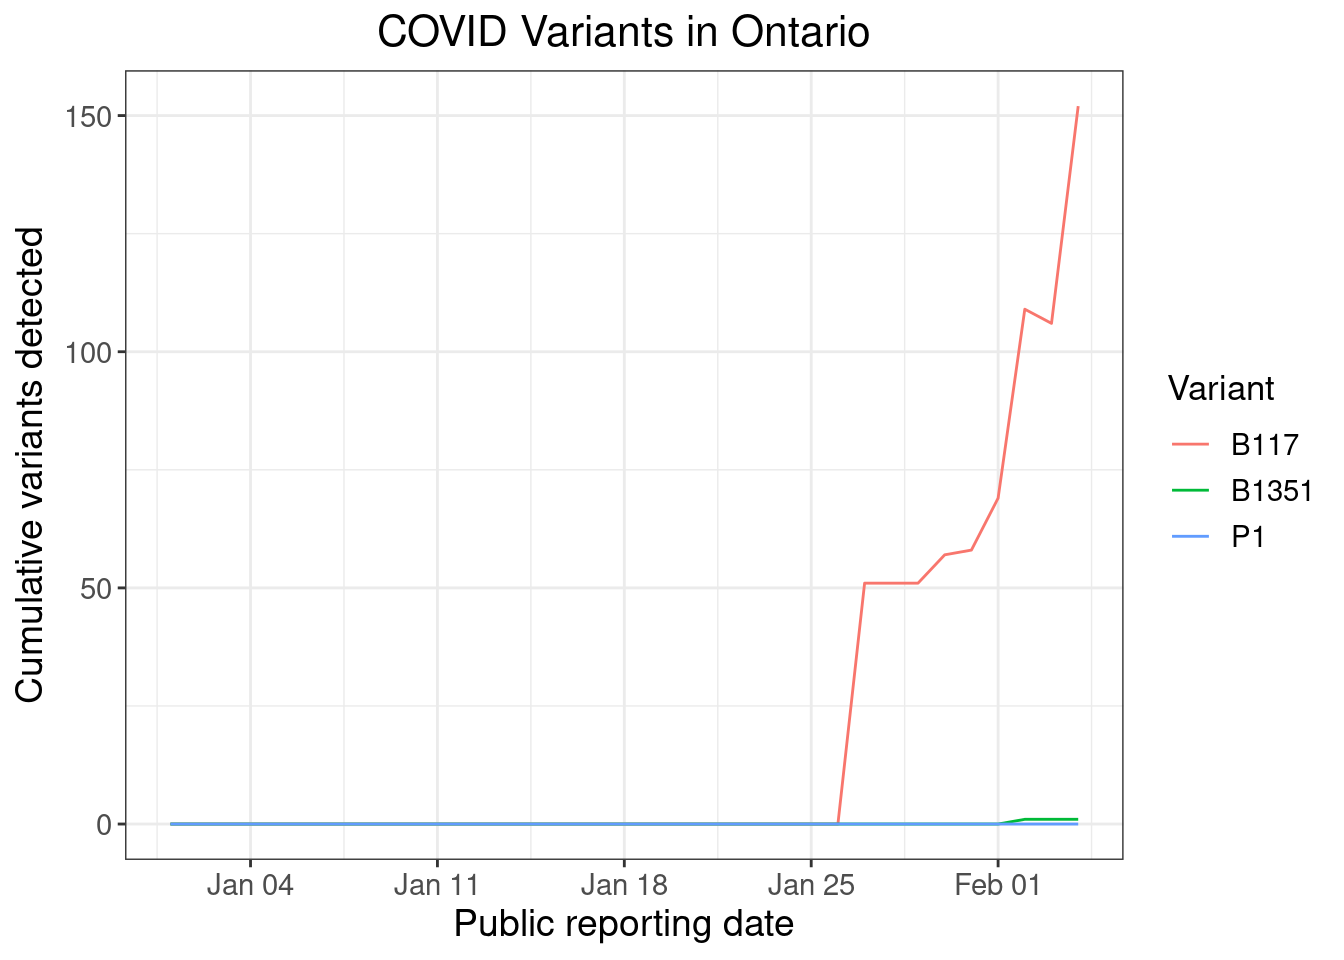
The first cases of the B.1.1.7 variant in Ontario were detected in late December. However, this database appears to pull primarily from the Public Health Ontario surveillance reports, which didn’t begin reporting variant detections until late January, which explains why these earlier numbers are missing.
Detection of COVID variants will increase
Surveillance for COVID variants is increasing, so we should naturally expect detections to increase rapidly in the weeks. For example, Public Health Ontario laboratories will be screening all positive tests for variants as well as ramping genomic testing up to a minimum of 10% of all positive samples.
At the same time, the variant itself is gaining market share and will be responsible for an increasing fraction of infections.
Spent the evening working with a colleague on new variant epidemiology in central Ontario.
It is worth being concerned. The R's for old variants and SGTF are divergent, with old variants < 1 and new variants still > 1, and gaining relative market share at 8% or so per day.
— David Fisman (@DFisman) February 1, 2021
Conclusion
More transmissable variants are here. The recent experience of the UK shows that they can be controlled using the same non-pharmaceutical measures as regular COVID, only it is more difficult. COVID is airborne, and this recognition should be foundational to our strategy for combating COVID-19.
You can download the raw data from this post here.
You can discuss this post on Twitter.